
Why Home Prices Rise and Fall: The Forces Behind the Numbers
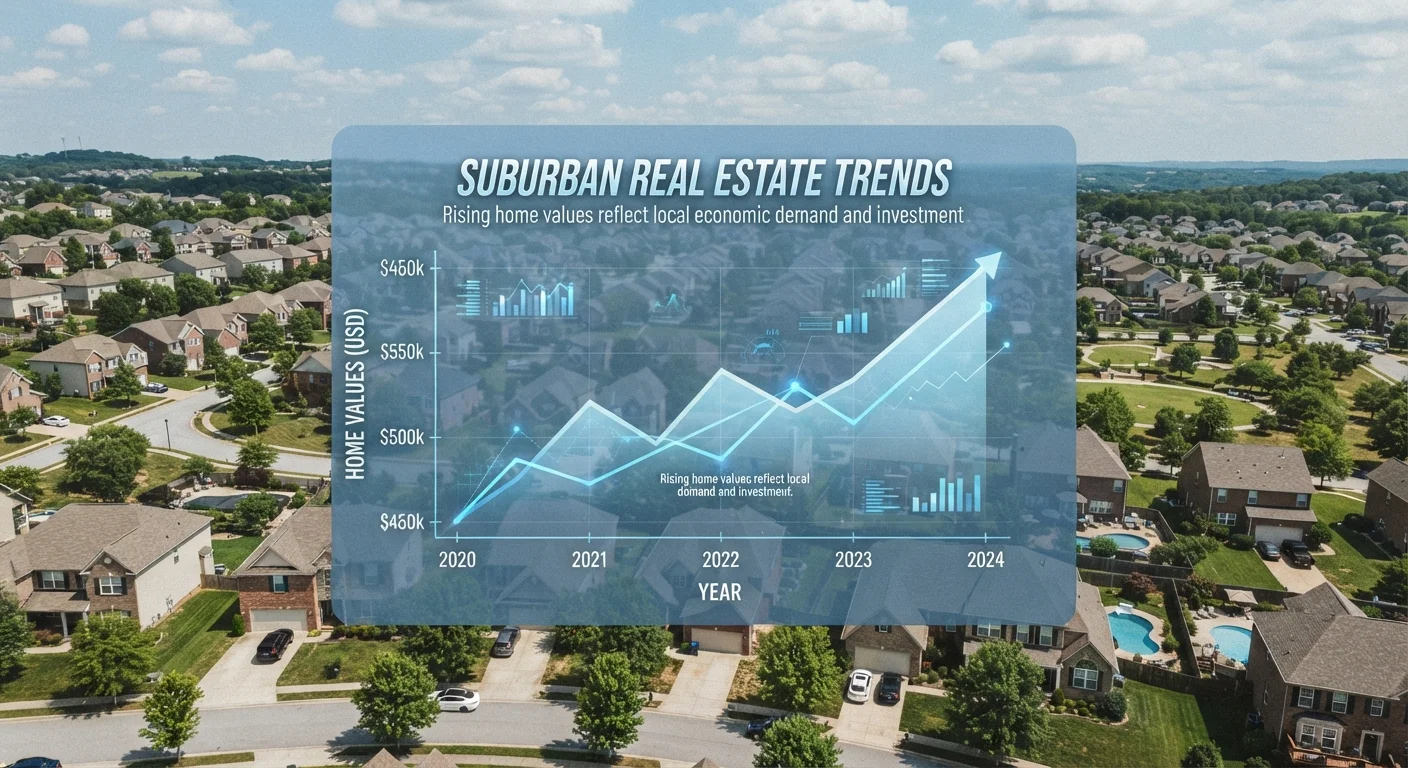
Photo credit: InfoHorizon.net | Access To Informative Content
In this article
Interest rates, inventory, employment, and migration patterns all shape home prices. Here's how each force works and how they interact.
Key Takeaways
- Interest rates directly affect how much home a buyer can afford, compressing or expanding demand almost immediately.
- Low housing inventory amplifies price increases; high inventory puts downward pressure on values.
- Local job growth and wage levels set a ceiling on what buyers in any market can realistically pay.
- Migration patterns — people moving toward or away from a metro — can shift a local market faster than national trends suggest.
- These forces interact, so a single favorable factor rarely offsets multiple unfavorable ones.
Supply and Demand: The Foundation
At its most basic, a home is worth what a willing buyer will pay and a willing seller will accept. Supply and demand determine that negotiation. When more buyers compete for fewer homes, prices rise. When listings outnumber serious buyers, sellers must cut prices to attract offers.
Housing supply is slow to respond to demand. Building a new home takes months; permitting and land acquisition can take years. Zoning restrictions in many American cities limit how much housing can be added to meet growth. This structural lag means that even modest increases in demand can produce outsized price jumps when inventory is tight.
For a deeper explanation of how inventory is measured and what the numbers signal, see Housing Market 101: What the Headlines Actually Mean.
4–6 months
Supply considered a balanced housing market
The National Association of Realtors has historically defined a market with roughly 4–6 months of available inventory as balanced between buyers and sellers.
~1%
Purchasing power change per rate point
A one-percentage-point increase in mortgage rates reduces a borrower's purchasing power by approximately 10%, assuming a fixed monthly budget — a widely cited approximation in mortgage lending education.
Top 3
Factors buyers cite for relocation decisions
Employment opportunity, housing affordability, and family proximity consistently rank as the top reasons American households choose where to buy, according to periodic NAR buyer surveys.
Interest Rates and Mortgage Affordability
Mortgage interest rates are among the most immediate price drivers because they directly determine monthly payment size. When rates rise, a buyer approved for the same monthly payment can afford a smaller loan — which limits how high they can bid on a home. When rates fall, purchasing power increases, and competition intensifies.
The relationship isn't perfectly symmetrical, however. A well-documented phenomenon called the lock-in effect occurs when homeowners with low-rate mortgages are reluctant to sell and give up their rate. This suppresses inventory at the same time rising rates suppress demand, which can slow sales volume without necessarily crashing prices.
How Interest Rate Changes Ripple Through the Housing Market traces this chain of effects in detail.
Watch Rate Changes Alongside Inventory
Don't evaluate interest rate moves in isolation. If rates rise but inventory remains very low, prices may hold or even continue climbing. Track both mortgage rate trends and active listing counts for the specific ZIP codes you're targeting to get an accurate read on local conditions.
Employment, Income, and Local Economic Health
Jobs drive housing demand. When a major employer expands in a metro area, workers relocate and existing residents gain income security — both dynamics push home values upward. Conversely, mass layoffs or industry contraction can stall a market quickly, as happened in several energy-dependent cities during oil price downturns.
Wage levels set a practical ceiling on home prices over the long run. If prices detach too far from local incomes, fewer residents can qualify for mortgages, demand softens, and price growth decelerates. Analysts often track the price-to-income ratio as a measure of affordability stress in a given market.
“Housing markets are fundamentally local. National averages describe a statistical construct that few individual buyers or sellers will ever actually experience.”
— Lawrence Yun, Chief Economist, National Association of Realtors
Migration and Demographic Shifts
Where people choose to live — and move — shapes housing demand over years and decades. Remote work flexibility that emerged in the early 2020s redistributed demand from expensive coastal cities toward Sun Belt metros and smaller secondary markets, contributing to rapid price appreciation in places like Boise, Austin, and Nashville.
Generational patterns matter too. As large cohorts of first-time buyers reach peak homebuying age simultaneously, they add a structural surge of demand regardless of economic conditions. Demographics don't move markets overnight, but they explain long-run directional pressure.
To understand what early warning signs look like before prices actually move, read Signals That a Local Housing Market Is Shifting Before Prices Move.
How These Forces Interact
The forces described above rarely move independently. A strong job market can sustain demand even when interest rates rise. Severe inventory constraints can keep prices elevated even when population growth slows. Understanding why a market is moving requires assessing which forces are dominant at a given moment.
This interaction also explains why national statistics can be misleading. A nationwide median price increase of 4% might mask a 12% rise in one city and a 2% decline in another. Always interrogate local data and understand which specific forces are at work in the market you care about.
For context on how these dynamics play out across an entire economic cycle, see The Housing Market Through an Economic Cycle: Boom, Correction, and Recovery. And if you've encountered sweeping claims about market timing or price crashes, Housing Market Myths That Keep Buyers and Sellers Stuck separates fact from persistent fiction.
National Data Has Limits
Headline figures like national median home price or average mortgage rate describe broad aggregates. Local markets can behave very differently depending on regional employment, migration, and land-use policy. Use national data as context, but base housing decisions on local market research and consult a licensed real estate professional familiar with your target area.
Frequently Asked Questions

Author
Real Estate Editorial Team
Real Estate Editorial Team is the collective byline for our editorial team and contributor network. Articles published under this byline or an editorial pen name are researched, written, and reviewed according to our editorial standards for clarity, consistency, and independence before publication.
View all articles →