
Housing Market 101: What the Headlines Actually Mean
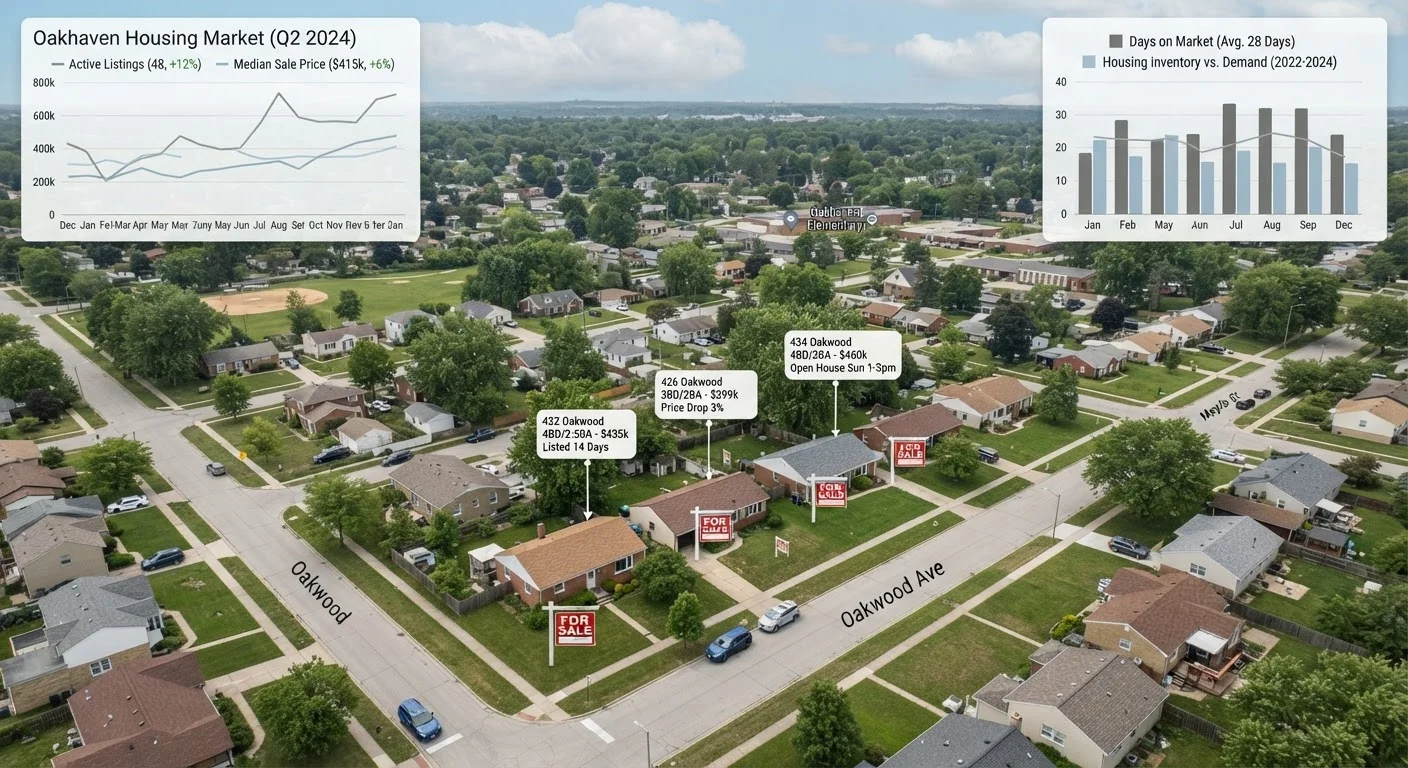
Photo credit: InfoHorizon.net | Access To Informative Content
In this article
Inventory levels, median prices, days on market—decoded. Learn what housing market terms really mean for everyday buyers and sellers.
Key Takeaways
- Median sale price and average sale price measure different things and tell different stories.
- Inventory levels—measured in months of supply—signal whether buyers or sellers hold more leverage.
- Days on market is one of the earliest indicators that a local market is shifting.
- National headlines rarely reflect conditions in your specific city, neighborhood, or price tier.
- Understanding market data helps you negotiate more confidently and time decisions more wisely.
Why Housing Market Headlines Can Mislead
Every week brings a fresh wave of housing market coverage: prices are up, prices are down, inventory is tight, a cooldown is coming. For buyers and sellers trying to make real decisions, these headlines often generate more anxiety than insight. The problem isn't that the data is wrong—it's that aggregate national figures routinely obscure what's happening in any specific place or price range.
A national report might show median prices rising, while a specific metro is seeing price reductions tick upward. A headline declaring a "buyer's market" could describe conditions three months old by the time it's published. To use housing data effectively, you need to understand what each metric actually measures—and what it doesn't.
For a deeper look at navigating these reports without getting overwhelmed, see how to read a housing market report without getting lost in the numbers.
Median sale price
The midpoint of all home sale prices in a period—half of homes sold for more, half for less. Less distorted by outliers than an average.
Months of supply
How long it would take to sell all active listings at the current sales pace if no new homes were added. A key gauge of market balance between buyers and sellers.
Days on market (DOM)
The number of days a home is listed before a purchase contract is signed. Rising DOM often signals a market cooling before price reductions appear.
Inventory
The total count of homes actively listed for sale at a given point in time. Low inventory typically increases competition among buyers.
Comparable sales (comps)
Recently sold homes that are similar in size, location, condition, and features to a home being priced. Comps are the standard tool for estimating a property's market value.
Seller's market
A market condition where demand from buyers exceeds the supply of homes for sale, giving sellers more leverage in negotiations and often driving prices upward.
Key Metrics Decoded: What the Numbers Actually Track
Most housing headlines draw from a small set of recurring data points. Knowing what each one actually measures changes how you interpret the news.
Median Sale Price
The median is the midpoint of all sale prices in a given period—half sold above, half below. It's preferred over the average because it isn't distorted by a small number of unusually expensive or cheap transactions. When the median rises, it generally means the middle of the market is getting pricier, though a shift in the mix of homes sold (more large homes, fewer starter homes) can also push the median up without any individual home gaining value.
Inventory and Months of Supply
Housing inventory counts the number of active listings at a given moment. Months of supply translates that into a more useful figure: how many months it would take to sell all current listings at the current pace of sales. Fewer than three months typically signals a seller's market with strong competition; more than six months typically gives buyers more negotiating room.
Days on Market (DOM)
DOM tracks the average time between a listing going live and a contract being signed. It's one of the earliest-moving indicators in a local market—DOM tends to lengthen before sellers start cutting prices. Early market shift signals like rising DOM can give attentive buyers and sellers a meaningful head start.
Track Multiple Metrics Together
No single data point tells the whole story. Pairing DOM trends with inventory levels and price-reduction rates gives a much more reliable read on where a local market is headed. If DOM is rising but prices haven't fallen yet, that gap often closes over the following months—useful intelligence for both buyers and sellers.
Buyer's Market vs. Seller's Market: More Nuanced Than You Think
These two terms get used constantly, but the reality is rarely binary. Most markets contain pockets of buyer and seller advantage simultaneously—often separated by price tier or neighborhood. A city might be a strong seller's market for homes under $400,000 (where competition is fierce) and a buyer's market for luxury properties above $900,000 (where inventory is ample and DOM is high).
Market conditions also shift at different speeds depending on what's driving them. A rise in mortgage rates can dampen buyer demand quickly, causing DOM to rise within weeks—but median prices often take months longer to reflect the change, because sellers are slow to reduce asking prices. This lag is why watching multiple indicators together gives a clearer picture than any single headline.
Many common assumptions about when markets shift—including the popular belief that spring is always the best time to buy—don't hold up to scrutiny when examined against actual market data.
Don't Confuse National Data With Your Local Market
Housing is one of the most location-specific asset classes there is. National averages can mask enormous variation between metros, neighborhoods, and price tiers. Before making any significant decision based on market headlines, verify that the data source covers your actual market area and price range.
How to Apply Market Data to Your Own Situation
National and state-level data provides useful context, but local data drives real decisions. When evaluating a market you're actively buying or selling in, focus on metrics at the zip-code or neighborhood level wherever possible. County assessor records, multiple listing service (MLS) statistics shared by local agents, and municipal housing departments often publish data at a granularity that national reports can't match.
For buyers, understanding inventory levels helps you calibrate how aggressively to make offers. In a low-inventory market, waiving contingencies is common but carries real risk—understanding why that's happening protects you. For sellers, DOM trends in your neighborhood help set realistic expectations for time on market and pricing strategy. Comparable sales remain the standard foundation for any pricing decision on a specific property.
If you're also weighing mortgage options as part of your homebuying process, understanding the difference between mortgage pre-qualification and pre-approval is an important parallel step. And for a comprehensive reference as you continue building your market literacy, the housing market glossary covers the full range of terms you'll encounter in reports and news coverage.
This article is for general informational and educational purposes only. It does not constitute financial, legal, or real estate advice. Consult a licensed real estate professional for guidance specific to your situation and local market.
Frequently Asked Questions

Author
Real Estate Editorial Team
Real Estate Editorial Team is the collective byline for our editorial team and contributor network. Articles published under this byline or an editorial pen name are researched, written, and reviewed according to our editorial standards for clarity, consistency, and independence before publication.
View all articles →