
National Trends vs. Local Markets: Why Your Zip Code Tells a Different Story
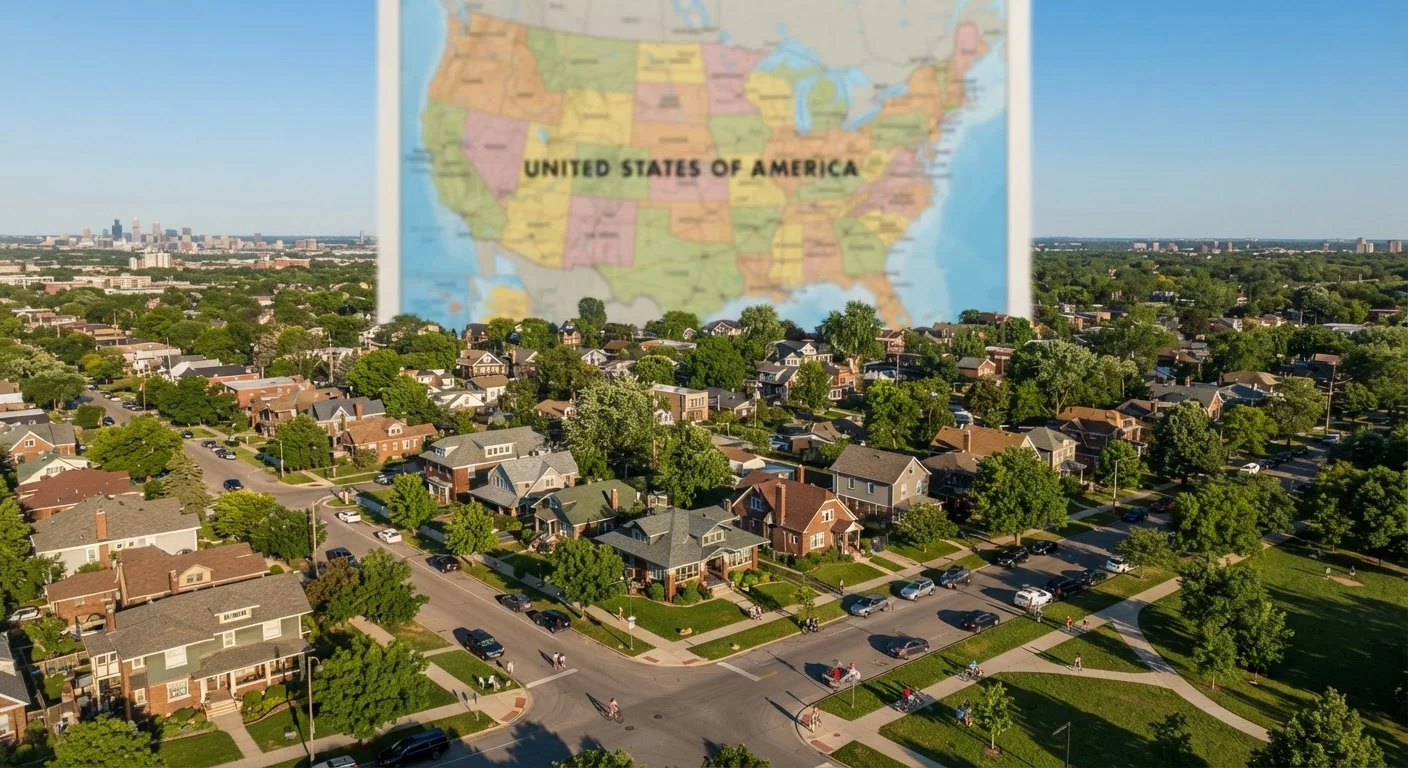
Photo credit: InfoHorizon.net | Access To Informative Content
In this article
National housing data rarely reflects your neighborhood. Learn why local supply, jobs, and demographics matter more than the national headline number.
Key Takeaways
- National housing statistics are averages that can obscure significant variation at the city, neighborhood, or zip code level.
- Local job markets, housing supply, and population trends are stronger price drivers than national headlines.
- Two adjacent zip codes in the same city can behave like entirely different housing markets.
- Buyers and sellers should prioritize local comparable sales data over national or even statewide reports.
- Understanding what a national metric actually measures helps you apply it accurately to your situation.
What National Housing Data Actually Measures
When you see a headline declaring that home prices rose or fell nationally, that figure is a composite — typically a median sale price or an index value — drawn from transactions across every type of market in the country. It aggregates hot Sun Belt metros, slow Rust Belt towns, dense urban cores, and rural counties into a single number.
That single number tells you something real about aggregate demand and mortgage market conditions, but it tells you almost nothing about what is happening on your street. As the Housing Market 101 guide explains, understanding what a metric actually measures is the first step to using it correctly. A national median price increase driven by expensive coastal markets may coexist with flat or declining prices in your metro.
900+
Metropolitan Statistical Areas tracked by U.S. federal agencies
The U.S. Office of Management and Budget defines over 900 core-based statistical areas, each with distinct economic and housing characteristics that national averages cannot capture.
~40%
Price variance between highest and lowest U.S. metro markets
Federal Housing Finance Agency (FHFA) house price index data consistently shows that appreciation rates between the highest- and lowest-performing metros can differ by 40 percentage points or more in a given year.
3–5 miles
Radius where comparable sales are most relevant
Real estate appraisers and agents typically prioritize comparable sales within a three-to-five-mile radius of a subject property to reflect genuinely local market conditions.
The Local Drivers That Override the National Average
Three forces shape local housing markets more powerfully than any national trend: employment, inventory, and demographics.
- Employment: A single large employer relocating to or from a metro can tighten or flood the local market within months. Areas with diversified, growing job bases tend to sustain demand even when national sentiment softens.
- Inventory: The ratio of homes listed for sale to qualified buyers in a given area determines whether buyers or sellers hold negotiating power. This ratio can differ dramatically between neighboring counties. For a deeper look at how inventory shapes your position, see our guide on buyer's markets versus seller's markets.
- Demographics and migration: Net population inflow — driven by remote work flexibility, cost-of-living arbitrage, or lifestyle preferences — elevates demand in destination markets regardless of national conditions.
Why Two Zip Codes in the Same City Can Tell Opposite Stories
Hyperlocal variation is one of real estate's most underappreciated dynamics. Within a single city, a zip code near a highly rated school district, a new transit line, or a revitalizing commercial corridor may see persistent price appreciation while a zip code a few miles away stagnates or declines.
Zoning is another dividing line. Areas with restrictive single-family zoning and limited land for new construction maintain supply scarcity even as demand grows. Adjacent areas permitting multifamily development can see inventory increases that moderate prices. These distinctions are invisible in any national or statewide data set.
Zoning Rules Vary Block by Block
Zoning designations — single-family only, mixed-use, multifamily permitted — are set at the municipal level and can change from one block to the next. These rules directly constrain future supply and therefore long-term price trajectories. Checking local zoning maps before buying in an area is a step many buyers overlook but that can meaningfully affect a property's future value.
Tracking early local signals — not just closed sale prices — gives you an edge. Days on market, the share of listings receiving price reductions, and listing volume shifts often move before final sale prices do. Our companion piece on signals that a local market is shifting before prices move walks through exactly what to watch.
How to Build a Local Market Picture You Can Act On
Practical market intelligence starts with sourcing the right data. County assessor records and MLS data disaggregated to the zip code or neighborhood level are more actionable than any national index. When reading broader reports — from the Census Bureau, the National Association of Realtors, or the FHFA — treat them as economic context, not local pricing guidance. Our editorial guide on using public housing data wisely explains the specific strengths and blind spots of each major government source.
Pair that macro context with granular local inputs: recent comparable sales within a half-mile radius, active listing counts for your target property type, and absorption rate (how quickly current inventory would sell at the present pace of demand). For a practical walkthrough of interpreting these figures together, see our guide on reading a housing market report without getting lost.
Ask for a Neighborhood-Level Absorption Rate
When working with a local agent, request the absorption rate — the number of months it would take to sell all current listings at the current pace of sales — specifically for your target zip code and property type. A rate below three months generally indicates a seller's market; above six months typically signals buyer leverage. This single figure is more actionable than any national headline.
No data source replaces conversations with an experienced local agent who can translate raw numbers into context — explaining, for example, why a zip code's median price dropped even as demand stayed strong, or how a new development pipeline will affect neighborhood supply over the next year.
Frequently Asked Questions

Author
Real Estate Editorial Team
Real Estate Editorial Team is the collective byline for our editorial team and contributor network. Articles published under this byline or an editorial pen name are researched, written, and reviewed according to our editorial standards for clarity, consistency, and independence before publication.
View all articles →